|

Vietnamese population in the US is estimated at 2,104,217 : 92.3% reporting one race, 7.0% reporting two races, 0.6% reporting three races, and 0.1% reporting four or more races, representing 0.8% of the population. It’s the sixth-largest foreign-born group in the country.
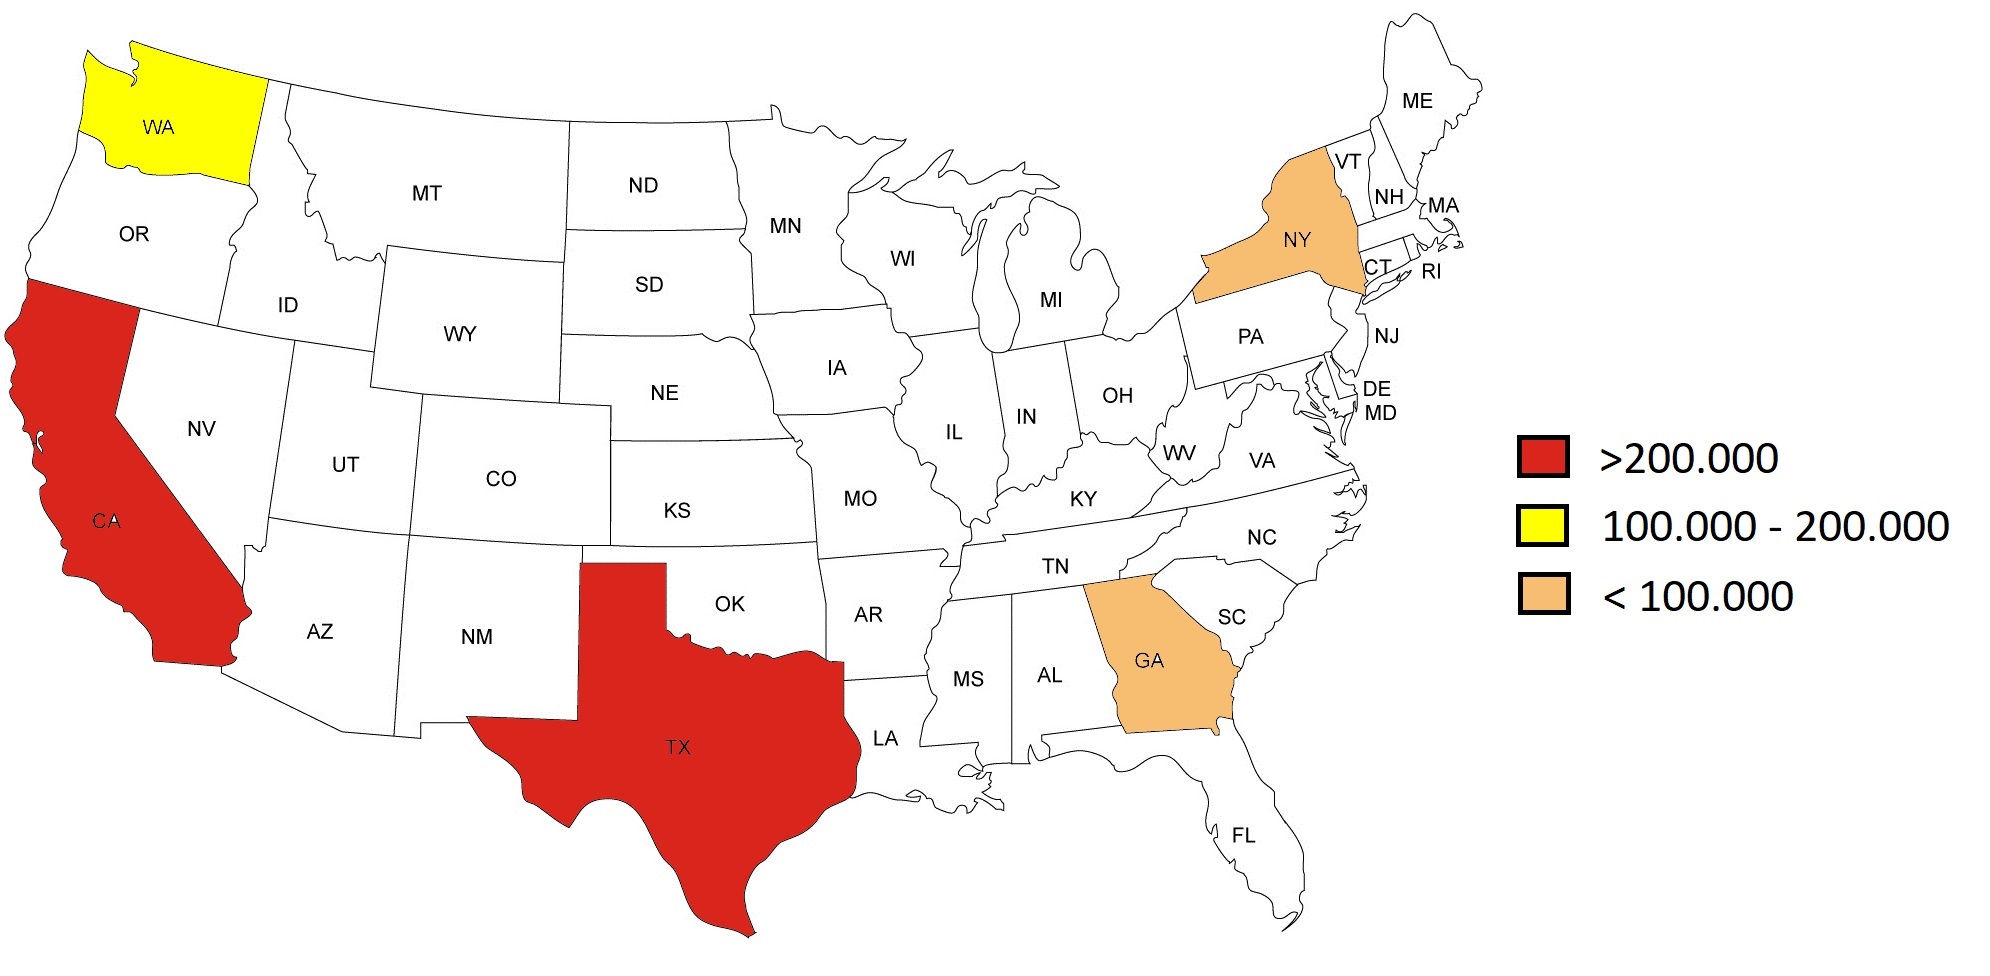
We find the largest communities of Vietnamese in California (585,000), Texas (205,000), Washington (147,000), Georgia (44,000) and New York (38,000).
 |
Language
We estimate 1,498,874 people older than five spoke Vietnamese at home in the United States.
|
|
Characteristics
| |
Vietnamese American |
American |
| Median Age |
36 |
38 |
| Median household income |
$65,643 |
$63,688 |
| Education |
31.2% of Vietnamese Americans had attained a bachelor's degree or higher |
33.4% Americans had attained a bachelor's degree or higher |
| Home owner |
65% |
64.8% |
| Employed (civilians ages 16 and older) |
63% |
62.9% |
|
|
Spending habits
71% of the
Vietnamese in the US try to buy foods grown locally to their homes. which consists largely of rice, a large quantity of vegetables and fruits, and fish, pork, tofu, poultry, nuts, and dry beans as the main proteins.
As a result, they purchase almost three times as much dry vegetables and grains.
Vietnamese are the most likely to send money overseas and 58% attend local cultural events or festivals.
| |
Vietnamese American |
Average U.S. Household |
| Housing |
9,7% |
32,9% |
| Food |
41,1% |
12,6% |
| Transport |
8,3% |
15,8% |
| Apparel |
3,6% |
3,1% |
| Entertainment |
1,0% |
5,1% |
| Healthcare |
4,9% |
8,1% |
| Other |
4,1% |
6,9% |
|
|
Digital presence
Linkedin subscribers
(active accounts) |
92 206 Vietnamese speakers living in USA.
99,8% are age between 20 to 55.
|
| Internet users |
66% |
| Active social media users |
64% |
| Frequency of internet use |
every day 94%.
At least once per week 6%. |
| Facebook users aged 13+ |
79% (48% female, 52% male)
69% are age between 20 to 55
|
| Instagram users aged 13+ |
8% (59% female, 41% male)
82% are age between 20 to 55
|
| Twitter users aged 13+ |
0,9% (33% female, 67% male) |
| Online buyers |
21% |
Views from some popular Vietnamese Youtube channels
| Channel |
From 09/07/19 to 10/06/19 |
| Thơ Nguyễn |
91.74 M |
| Truyen Hinh Vinh Long |
54.91 M |
| DIEN QUAN Comedy / Hài |
35.29 M |
| Ghiền Mì Gõ |
57.68 M |
|
|
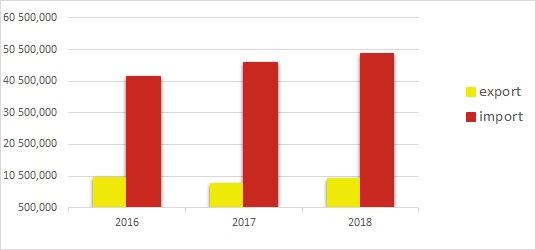
Trade
From 2016 to 2018 trade between the United States and Vietnam increase, with export at 9,675 billion and import at 49,173 billion in 2018.
|
|
Sources:
https://www.pewsocialtrends.org/fact-sheet/asian-americans-vietnamese-in-the-u-s-fact-sheet/
https://en.wikipedia.org/wiki/Vietnamese_Americans
https://www.migrationpolicy.org/article/vietnamese-immigrants-united-states-5
https://www.statista.com/statistics/183483/ranking-of-languages-spoken-at-home-in-the-us-in-2008/
https://www.bls.gov/emp/tables/civilian-labor-force-participation-rate.htm
https://www.nielsen.com/wp-content/uploads/sites/3/2019/04/nielsen-asian-american-consumer-report-may-2016.pdf
https://www.cnbc.com/2017/09/27/how-your-spending-compares-to-the-average-american-and-us-government.html
http://economists-pick-research.hktdc.com/business-news/article/Research-Articles/Vietnam-s-Consumer-Preference-for-Affordable-Luxuries/rp/en/1/1X000000/1X0A9WQM.htm
https://vidooly.com/top-youtube-channels/VN/mostviewed
https://www.slideshare.net/DataReportal/digital-2019-vietnam-january-2019-v01
https://www.census.gov/foreign-trade/balance/c5520.html
|

| |
Capricorn
arranges multi channel advertising solutions using independent media,
while maximizing brand exposure and customer acquisition.
Since 1999, Capricorn explores opportunities in highly specific ethnic
and immigrants markets, beyond what other ad agencies have exploited
before.
Capricorn helps to promote companies and organizations looking to reach specific communities:
- People who have a strong interest in foreign destinations and cultures like Francophiles.
- Expatriate people who live in the US with a foreign born origin
like Australian, Belgian, Brazilian, Dutch, French, German, Greek,
Italian, Irish, New Zealander, Portuguese, Swiss, African, Sub Sahara
African, Asian, Hispanic.
- People in the US who speak a specific language like Arabic,
Brazilian, Dutch, Cantonese, Creole, French, German, Greek, Hebrew,
Italian, Kannada, Mandarin, Portuguese, Spanish, Urdu.
|
|